Background
- The expansion of Citibike stations
- The challenge of rebalancing Citibikes
- High demand in rush hour and summer
- Past research: relationship between Citibike ridership and neighborhood demographics based on cencus tracts
Possible Questions
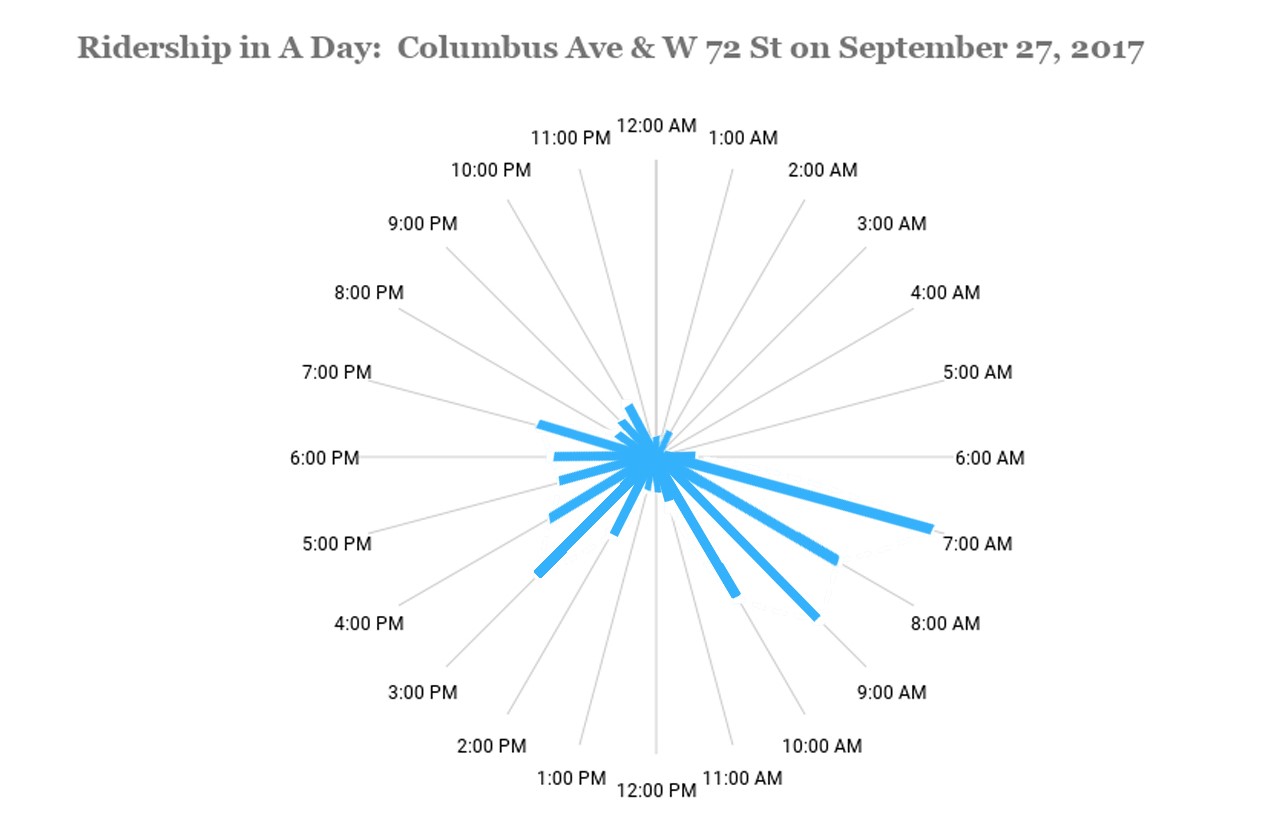
- What is the ridership change in different time period or time series?
- What is the availability of CitiBike at each Station?
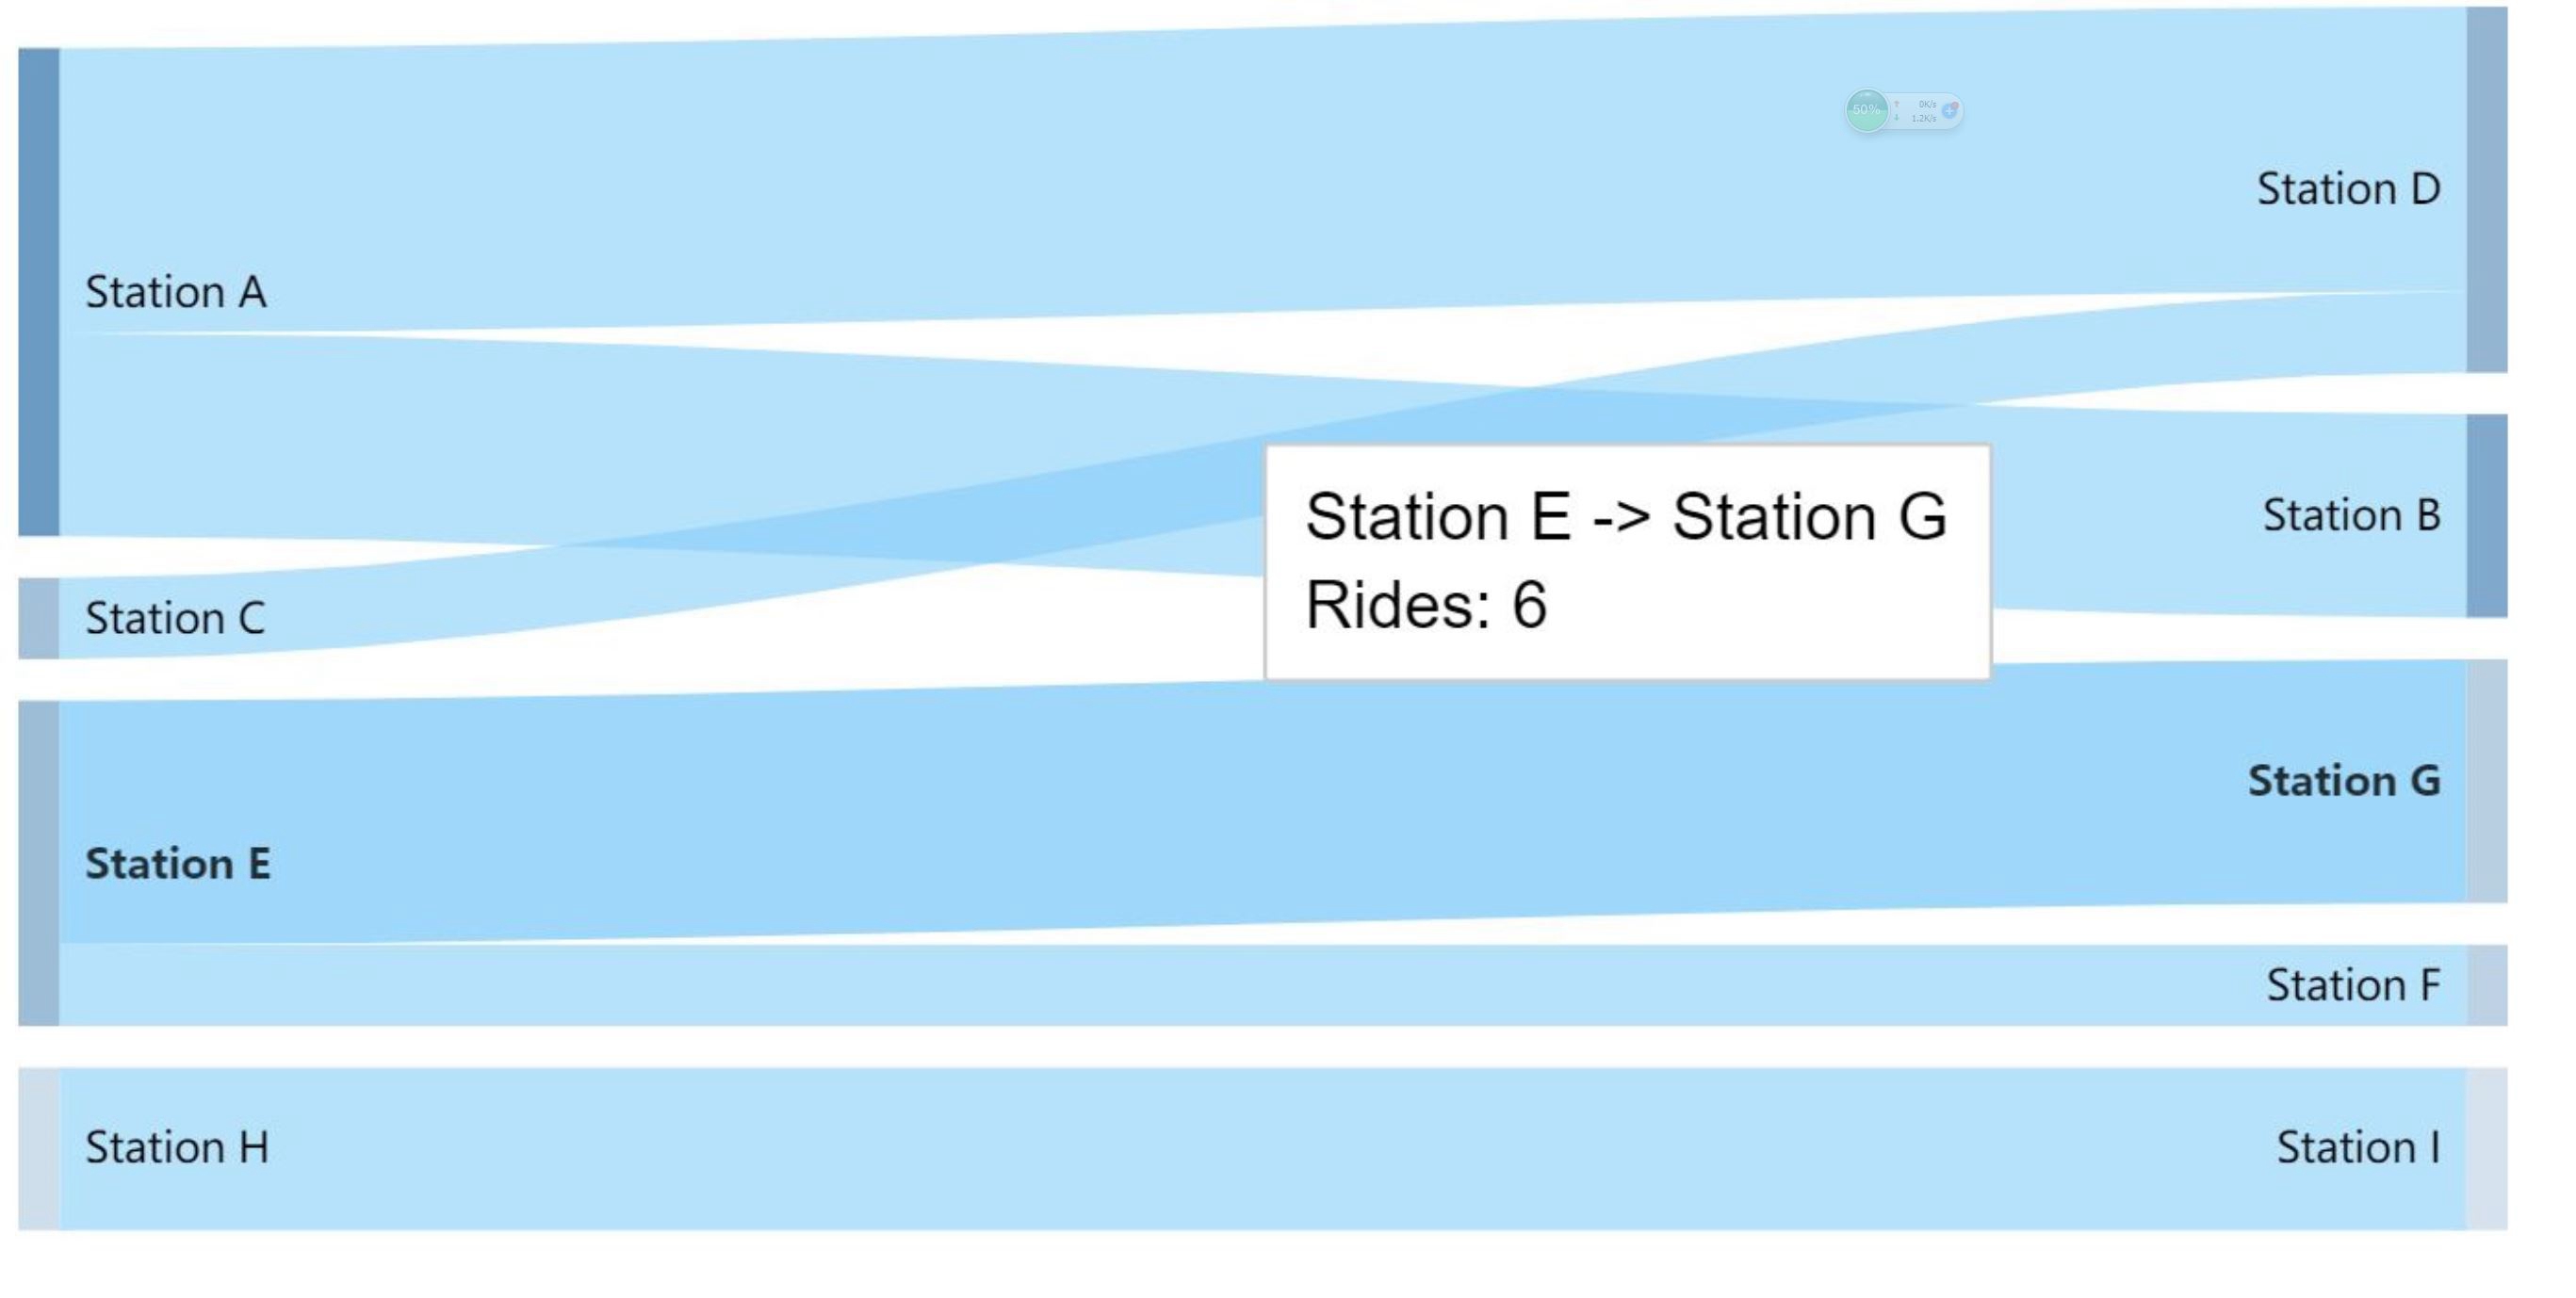
- Where do bikes come and where do bikes go?
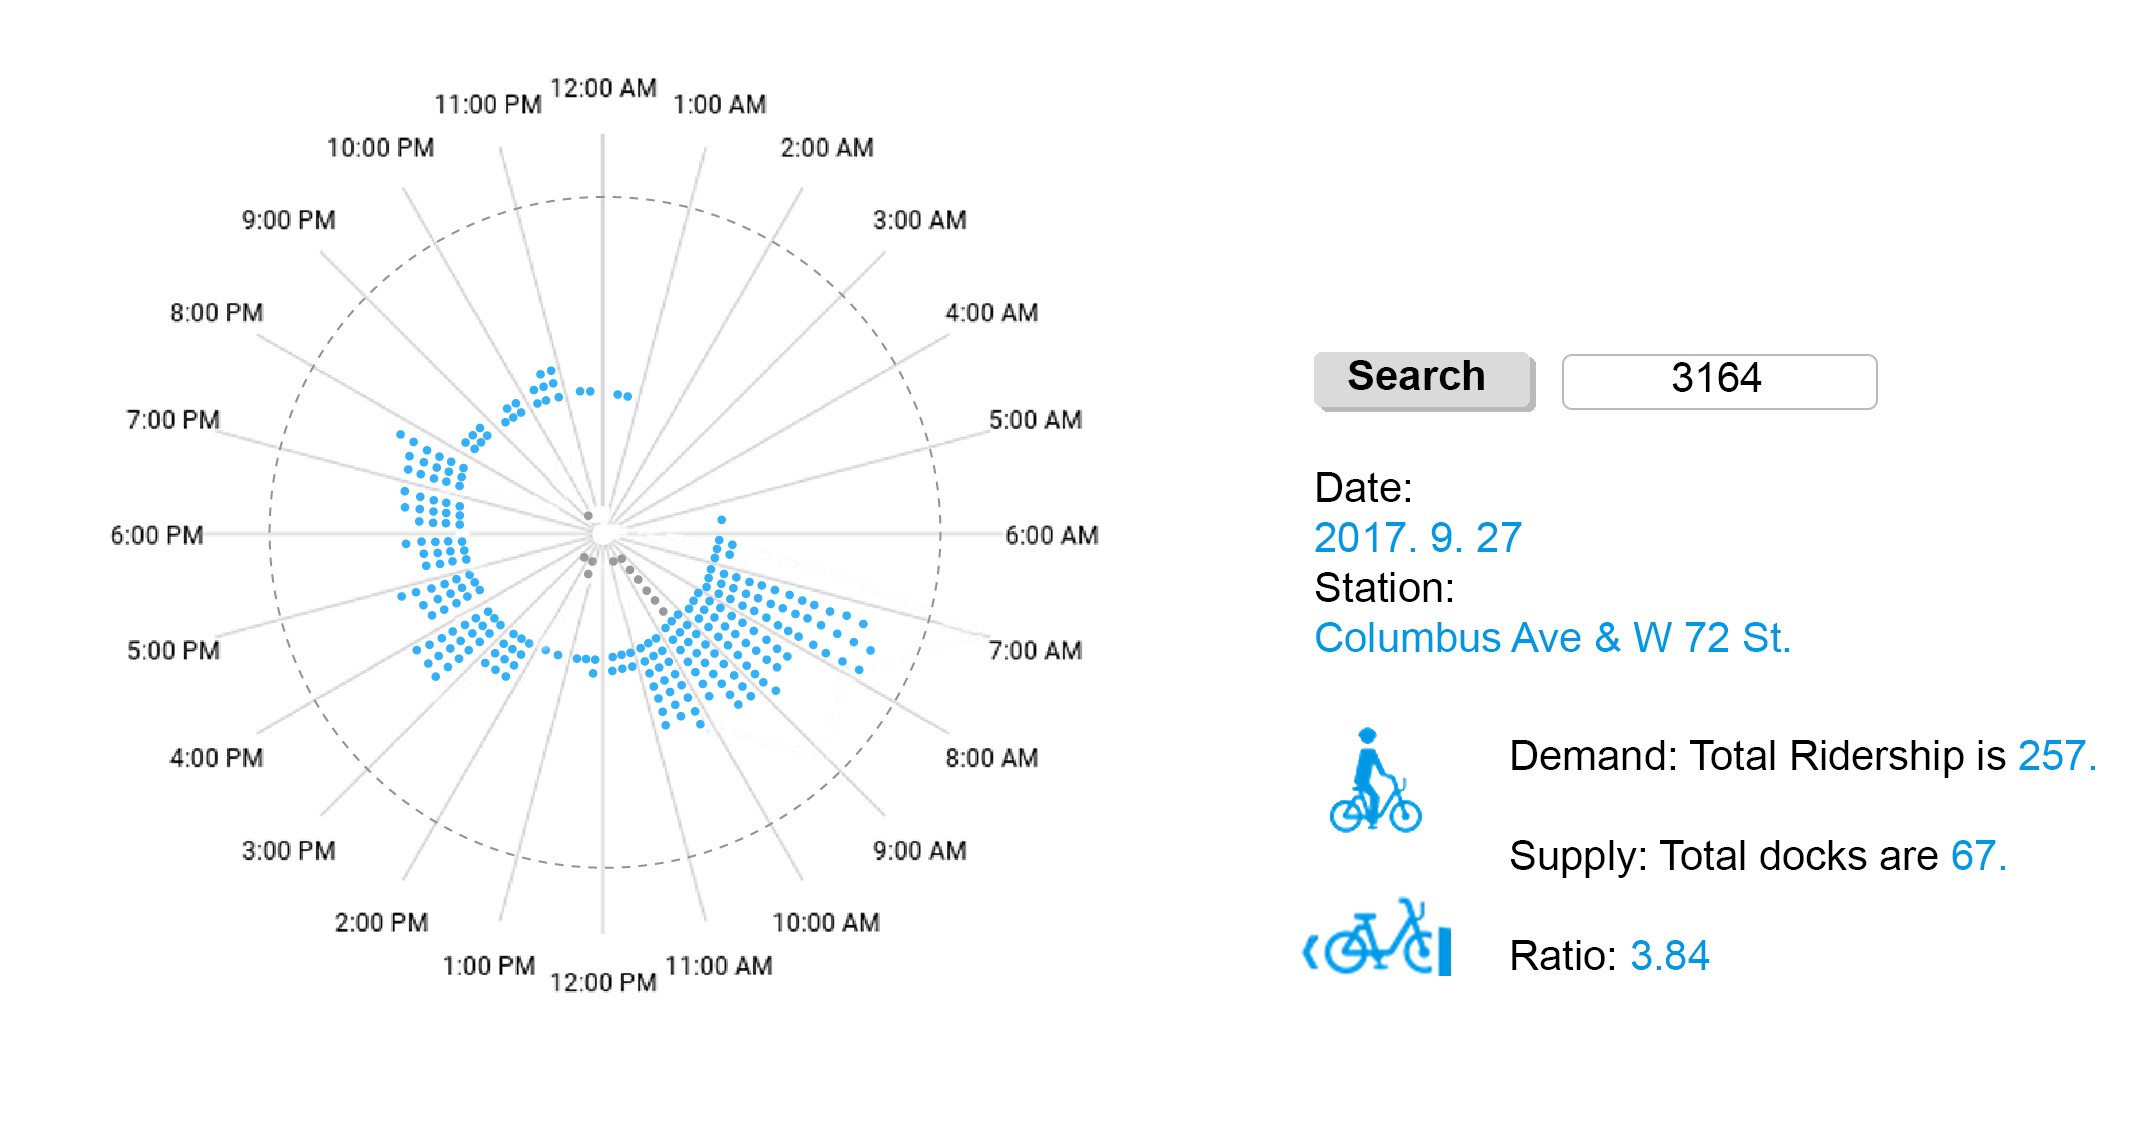
- What is the supply and demand of Citibike at each station? How can we evaluate it?
Sketch 1
Sketch 2. Where do bikes come and wher do bikes go?
Sketch 3. Checking supply and demand of CitiBike at different stations with interactive searching function
Data Source
CitiBike. Citi Bike Trip Histories. https://www.citibikenyc.com/system-data.
General Bikeshare Feed Specification (GBFS). https://github.com/NABSA/gbfs/blob/master/gbfs.md.
Station information. https://gbfs.citibikenyc.com/gbfs/en/station_information.json.
Real-time station status. https://feeds.citibikenyc.com/stations/stations.json.
References
1. Google News Lab. “Rhythm of Food”. http://rhythm-of-food.net/. Accessed on March 21, 2018.
2. Highcharts: Wind Rose Chart. https://www.highcharts.com/demo/polar-wind-rose/sand-signika.
3. Rebalancing Citi Bike. https://run.unl.pt/bitstream/10362/17842/1/TGEO0145.pdf.
4. Riders: Citi Bike Struggling To Balance Supply And Demand; App Unreliable. http://newyork.cbslocal.com/2013/08/15/riders-citi-bike-struggling-to-balance-supply-and-demand-app-unreliable/.
5. Citi Bike Availability. Jhonasttan Regalado. https://jhonasttan.shinyapps.io/citibikeanalysis/.